London Precipitation: Average Monthly Rainfall and Snowfall
This graph shows the average amount of rainfall per month in London (Greater London). The numbers are calculated over a 30-year period to provide a reliable average.
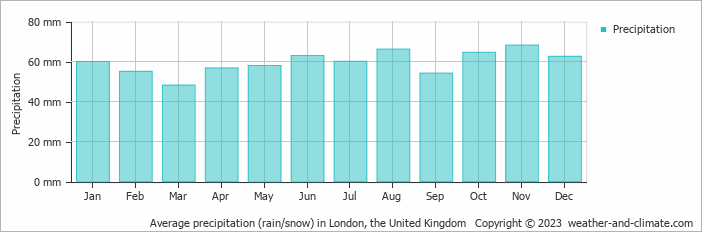
- On average, November is the wettest month with 68 mm of precipitation.
- On average, March is the driest month with 48 mm of precipitation.
- The average amount of annual precipitation is 716 mm.
Current rainfall in London
Wed Oct 23
17°C | 10°C
S  18 km/h
18 km/hbroken clouds and no rain
Thu Oct 24
17°C | 10°C
S 22 km/h
22 km/halmost clear and no rain
Fri Oct 25
17°C | 10°C
SE 18 km/h
18 km/h0.6 mm
overcast and slight rain


