Woodbridge Sunshine Hours by Month
When exploring climate, sunlight hours tell an important story. This page shows the total number of hours of direct sunlight per month and the average hours per day in Woodbridge, Virginia, United States of America. The numbers reflect climate data gathered over a 30-year period, from 1990 to 2020.
Monthly hours of sunshine
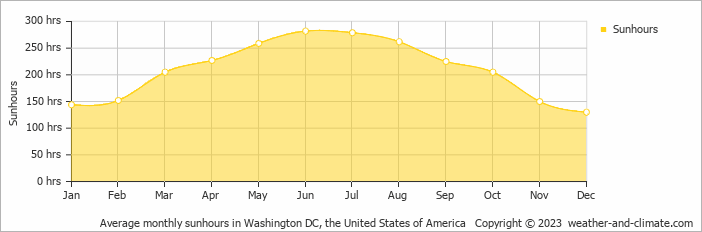
If you're visiting Woodbridge, timing is key. In June, you can enjoy up to 282 hours of sunshine, while the shorter days of December provide just 130 hours. The total annual amount of sun is 2520 hours.
Daily hours of sunshine
In Woodbridge, summer days are longer and more sunny, with daily sunshine hours peaking at 9.4 hours in June. As the darker season arrives, the brightness of the sun becomes less. December sees a soft sun for only 4.3 hours per day.
Average percent of sunshine
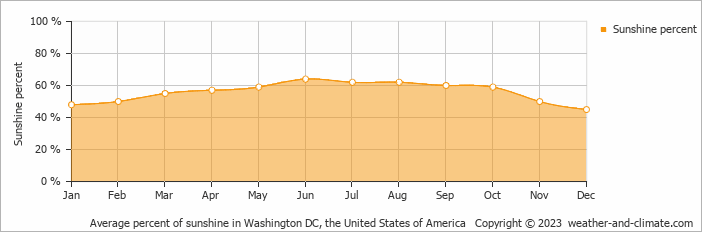
On average the sun shines 64% of the time during the day in June, the highest percentage of any month. December has the lowest percentage at 45%.
Woodbridge vs Major Cities: Sunshine Compared
Woodbridge enjoys an average of 2520 hours of sunshine annually. Let’s compare this with some popular tourist destinations:
The city of Rome, Italy, experiences 2470 hours of sunshine annually, adding to its charm as a year-round tourist destination.
In contrast, Brussels, Belgium, receives only about 1590 hours of sunshine per year, known for its frequently overcast and rainy skies.
Toronto, Canada, sees around 2071 hours of sunshine each year, with especially long, bright summer days.
In Brisbane, Australia, the annual sunshine averages 2999 hours, making it one of Australia’s sunniest cities.
Related Climate Data for Woodbridge
June, Woodbridge’s wettest month, receives 100 mm (3.9 in) of rainfall and has a maximum daytime temperature of 29°C (84°F). During the driest month February you can expect a temperature of 8°C (46°F).
For more detailed insights into the city’s temperatures, check out our Temperature page. To explore more about precipitation patterns, visit our Woodbridge Precipitation page.


