Valle de Guerra Sunshine Hours by Month
To truly understand a climate, we must look at its sunshine. This page shows the total number of hours of direct sunlight per month and the average hours per day in Valle de Guerra, Canary Islands, Spain. Long-term data from 1990 to 2020 was used to calculate these averages.
Monthly hours of sunshine
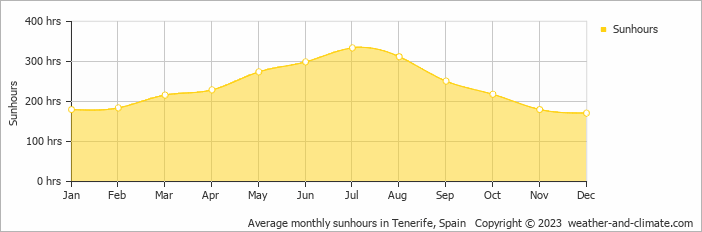
Sunshine in Valle de Guerra varies greatly throughout the year. The sunniest month, July, reaches an impressive 334 hours, while December, the darkest month, offers only 171 hours. The total annual amount of sun is 2848 hours.
Daily hours of sunshine
For those who appreciate different seasons, Valle de Guerra serves as an ideal destination. Expect longer, more sun-filled days in July with an average of 11.1 hours of sunshine daily, and embrace the darker days in December, offering only 5.7 hours of daily sunlight.
Average percent of sunshine
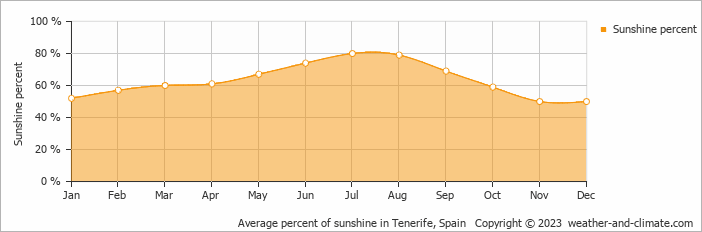
On average the sun shines 80% of the time during the day in July, the highest percentage of any month. November has the lowest percentage at 50%.
Valle de Guerra vs Major Cities: Sunshine Compared
Valle de Guerra enjoys an average of 2848 hours of sunshine annually. Let’s compare this with some popular tourist destinations:
Athens, Greece, enjoys 2769 hours of sunshine each year, making it one of the sunniest destinations in the Mediterranean region.
In contrast, Tromsø , Norway, receives only about 1270 hours of sunshine per year, known for the polar night with no sunlight for weeks during winter.
Vancouver, Canada, receives approximately 1940 hours of sunshine annually.
In Brisbane, Australia, the annual sunshine averages 2999 hours, making it one of Australia’s sunniest cities.
Related Climate Data for Valle de Guerra
December, Valle de Guerra’s wettest month, receives 13 mm (0.5 in) of rainfall and has a maximum daytime temperature of 20°C (68°F). During the driest month August you can expect a temperature of 23°C (73°F).
For more detailed insights into the city’s temperatures, check out our Temperature page. To explore more about precipitation patterns, visit our Valle de Guerra Precipitation page.


