Valdaliga Sunshine Hours by Month
To truly understand a climate, we must look at its sunshine. This page shows the total number of hours of direct sunlight per month and the average hours per day in Valdaliga , Cantabria, Spain. These values are calculated using 30 years of data (1990–2020) to ensure accuracy.
Monthly hours of sunshine
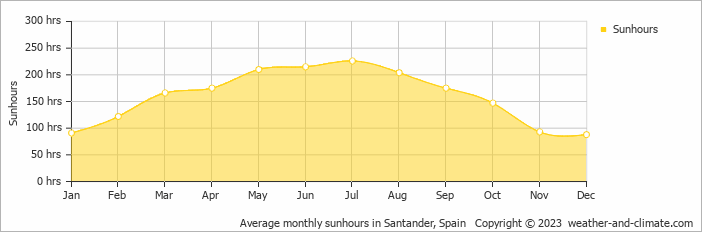
Seasonal sunshine in Valdaliga varies. It peaks at 226 hours in July and drops to 88 hours in December. The total annual amount of sun is 1912 hours.
Daily hours of sunshine
Seasonal changes in sunshine hours are quite obvious in Valdaliga . While July receives considerable daily sunshine with up to 7.5 hours, December marks the darkest time of the year, where sunshine is scarce with only 2.9 hours of sunlight per day.
Valdaliga vs Major Cities: Sunshine Compared
Valdaliga enjoys an average of 1912 hours of sunshine annually. Let’s compare this with some popular tourist destinations:
The city of Rome, Italy, experiences 2470 hours of sunshine annually, adding to its charm as a year-round tourist destination.
Manchester, UK, experiences just around 1420 hours of sunshine annually.
In Shanghai, China, the annual average sunshine is 1780 hours, with cloudier weather in summer.
Melbourne, Australia, has 2380 hours of sunshine annually, with its famous “four seasons in a day” weather pattern.
Related Climate Data for Valdaliga
November, Valdaliga ’s wettest month, receives 100 mm (3.9 in) of rainfall and has a maximum daytime temperature of 15°C (59°F). During the driest month July you can expect a temperature of 22°C (72°F).
For more detailed insights into the city’s temperatures, check out our Temperature page. To explore more about precipitation patterns, visit our Valdaliga Precipitation page.


