Upper Princeʼs Quarter Sunshine Hours by Month
Sunshine is key to understanding how a place experiences its seasons. This page shows the total number of hours of direct sunlight per month and the average hours per day in Upper Princeʼs Quarter, Sint Maarten. Long-term data from 1990 to 2020 was used to calculate these averages.
Monthly hours of sunshine
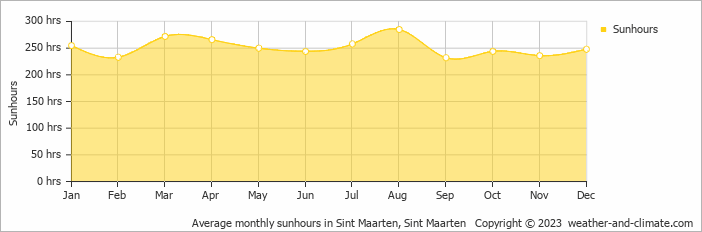
Year-round, Upper Princeʼs Quarter offers consistent sunshine. The difference between the sunniest month, August, with 285 hours, and September, the least sunny month, with 232, is minimal. The total annual sunshine amounts to 3023 hours.
Daily hours of sunshine
If you're planning a trip to Upper Princeʼs Quarter, rest assured that sunshine is an important factor. With peak sunshine in August at 9.5 hours daily and a slight dip to 7.7 hours in September, it maintains a sunny destination year-round.
Average percent of sunshine
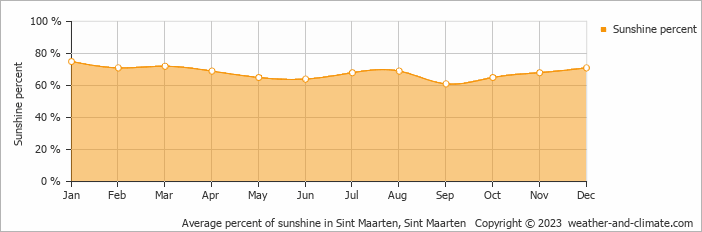
On average the sun shines 75% of the time during the day in January, the highest percentage of any month. September has the lowest percentage at 61%.
Upper Princeʼs Quarter vs Major Cities: Sunshine Compared
Upper Princeʼs Quarter enjoys an average of 3023 hours of sunshine annually. Let’s compare this with some popular tourist destinations:
The city of Rome, Italy, experiences 2470 hours of sunshine annually, adding to its charm as a year-round tourist destination.
In contrast, Tromsø , Norway, receives only about 1270 hours of sunshine per year, known for the polar night with no sunlight for weeks during winter.
Stockholm, Sweden, receives approximately 1907 hours of sunshine annually.
Adelaide, Australia, enjoys 2770 hours of sunshine annually, with long, sunny summers.
Related Climate Data for Upper Princeʼs Quarter
October, Upper Princeʼs Quarter’s wettest month, receives 97 mm (3.8 in) of rainfall and has a maximum daytime temperature of 29°C (84°F). During the driest month March you can expect a temperature of 27°C (81°F).
For more detailed insights into the city’s temperatures, check out our Temperature page. To explore more about precipitation patterns, visit our Upper Princeʼs Quarter Precipitation page.


