Ocean Grove Sunshine Hours by Month
When exploring climate, sunlight hours tell an important story. This page shows the total number of hours of direct sunlight per month and the average hours per day in Ocean Grove, Victoria, Australia. These averages rely on historical data collected over 30 years, from 1990 to 2020.
Monthly hours of sunshine
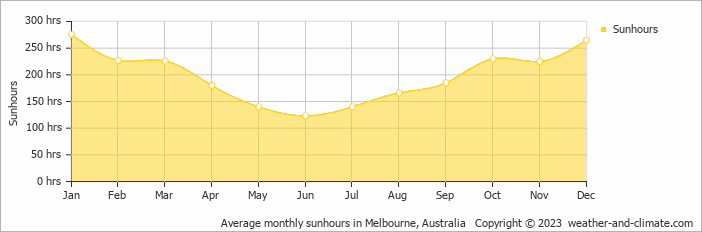
Those who love seasonal contrasts will appreciate Ocean Grove. Expect long, bright days with 276 hours in January and darker periods with just 123 hours in June. The total annual amount of sun is 2383 hours.
Daily hours of sunshine
Seasonal changes in sunshine hours are quite obvious in Ocean Grove. While January receives considerable daily sunshine with up to 9.2 hours, June marks the darkest time of the year, where sunshine is scarce with only 4.1 hours of sunlight per day.
Average percent of sunshine
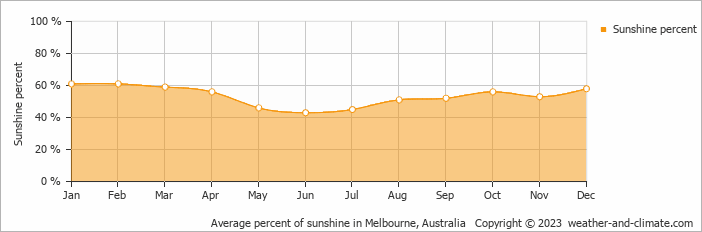
On average the sun shines 61% of the time during the day in February, the highest percentage of any month. June has the lowest percentage at 43%.
Ocean Grove vs Major Cities: Sunshine Compared
Ocean Grove enjoys an average of 2383 hours of sunshine annually. Let’s compare this with some popular tourist destinations:
The city of Rome, Italy, experiences 2470 hours of sunshine annually, adding to its charm as a year-round tourist destination.
In contrast, Tromsø , Norway, receives only about 1270 hours of sunshine per year, known for the polar night with no sunlight for weeks during winter.
Beijing, China, has 2505 hours of sunshine annually, with clear, sunny days in winter.
In Brisbane, Australia, the annual sunshine averages 2999 hours, making it one of Australia’s sunniest cities.
Related Climate Data for Ocean Grove
September, Ocean Grove’s wettest month, receives 47 mm (1.9 in) of rainfall and has a maximum daytime temperature of 16°C (61°F). During the driest month March you can expect a temperature of 21°C (70°F).
For more detailed insights into the city’s temperatures, check out our Temperature page. To explore more about precipitation patterns, visit our Ocean Grove Precipitation page.


