Murwillumbah Sunshine Hours by Month
When exploring climate, sunlight hours tell an important story. This page shows the total number of hours of direct sunlight per month and the average hours per day in Murwillumbah, New South Wales, Australia. These averages rely on historical data collected over 30 years, from 1990 to 2020.
Monthly hours of sunshine
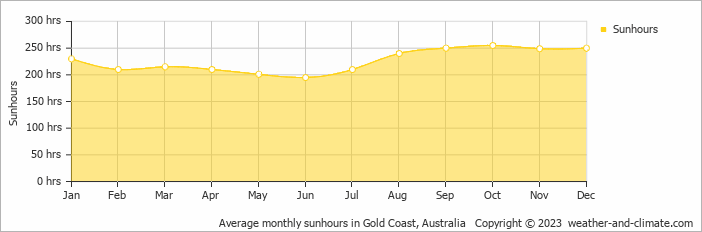
While the amount of sunshine in Murwillumbah changes moderately throughout the year, the annual total remains impressive at around 2715 hours. Expect slightly brighter days in October and a subtle dip in June.
Daily hours of sunshine
This means you can enjoy sunny spells year-round. October sees up to 8.5 hours of daily sunshine, perfect for a sunny trip. June, the least sunny month, still offers a generous 6.5 hours of sun despite this cloudier / rainier time of the year.
Murwillumbah vs Major Cities: Sunshine Compared
Murwillumbah enjoys an average of 2715 hours of sunshine annually. Let’s compare this with some popular tourist destinations:
Athens, Greece, enjoys 2769 hours of sunshine each year, making it one of the sunniest destinations in the Mediterranean region.
In contrast, Reykjavík, Iceland, receives only about 1330 hours of sunshine per year, known for its frequently overcast and rainy skies.
Boston, USA, enjoys 2629 hours of sunshine annually, with distinct seasons and many bright, sunny days.
In Tokyo, Japan, the average annual sunshine is 1930 hours, with sunny periods between rainy seasons.
Related Climate Data for Murwillumbah
February, Murwillumbah’s wettest month, receives 161 mm (6.3 in) of rainfall and has a maximum daytime temperature of 28°C (82°F). During the driest month July you can expect a temperature of 20°C (68°F).
For more detailed insights into the city’s temperatures, check out our Temperature page. To explore more about precipitation patterns, visit our Murwillumbah Precipitation page.


