Marigot Bay Sunshine Hours by Month
When exploring climate, sunlight hours tell an important story. This page shows the total number of hours of direct sunlight per month and the average hours per day in Marigot Bay, Castries, Saint Lucia. This average is based on long-term data collected between 1990 and 2020.
Monthly hours of sunshine
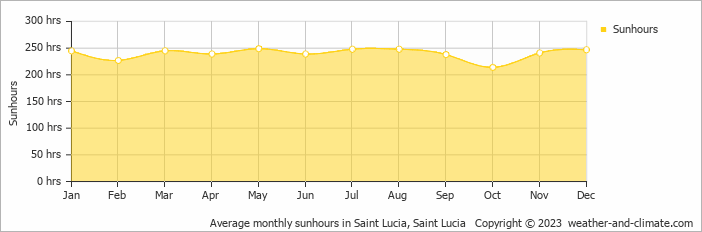
On average, Marigot Bay receives plenty of sunlight throughout the year. The annual sunshine totals up to approximately 2880 hours, making it a consistently bright destination.
Daily hours of sunshine
If you're planning a trip to Marigot Bay, rest assured that sunshine is an important factor. With peak sunshine in May at 8.3 hours daily and a slight dip to 7.1 hours in October, it maintains a sunny destination year-round.
Marigot Bay vs Major Cities: Sunshine Compared
Marigot Bay enjoys an average of 2880 hours of sunshine annually. Let’s compare this with some popular tourist destinations:
The city of Rome, Italy, experiences 2470 hours of sunshine annually, adding to its charm as a year-round tourist destination.
Manchester, UK, experiences just around 1420 hours of sunshine annually.
Oslo, Norway, receives approximately 1690 hours of sunshine annually.
In Brisbane, Australia, the annual sunshine averages 2999 hours, making it one of Australia’s sunniest cities.
Related Climate Data for Marigot Bay
October, Marigot Bay’s wettest month, receives 124 mm (4.9 in) of rainfall and has a maximum daytime temperature of 31°C (88°F). During the driest month February you can expect a temperature of 29°C (84°F).
For more detailed insights into the city’s temperatures, check out our Temperature page. To explore more about precipitation patterns, visit our Marigot Bay Precipitation page.


