General Roca Sunshine Hours by Month
Sunshine is key to understanding how a place experiences its seasons. This page shows the total number of hours of direct sunlight per month and the average hours per day in General Roca, Río Negro, Argentina. The figures are based on a 30-year period (1990–2020) to provide a reliable average.
Monthly hours of sunshine
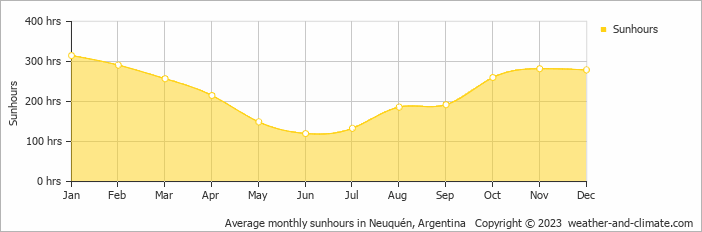
Sunshine in General Roca varies greatly throughout the year. The sunniest month, January, reaches an impressive 315 hours, while June, the darkest month, offers only 120 hours. The total annual amount of sun is 2679 hours.
Daily hours of sunshine
This means the city can be enjoyed more throughout the sunniest month of January under a blue sky, with approximately 10.5 hours of sunshine daily. In contrast, the city experiences much darker days in June, with only 4.0 hours of sunlight per day.
Average percent of sunshine
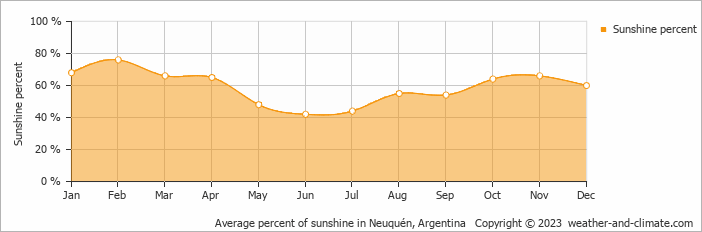
On average the sun shines 76% of the time during the day in February, the highest percentage of any month. June has the lowest percentage at 42%.
General Roca vs Major Cities: Sunshine Compared
General Roca enjoys an average of 2679 hours of sunshine annually. Let’s compare this with some popular tourist destinations:
The city of Rome, Italy, experiences 2470 hours of sunshine annually, adding to its charm as a year-round tourist destination.
Manchester, UK, experiences just around 1420 hours of sunshine annually.
In Shanghai, China, the annual average sunshine is 1780 hours, with cloudier weather in summer.
In Brisbane, Australia, the annual sunshine averages 2999 hours, making it one of Australia’s sunniest cities.
Related Climate Data for General Roca
October, General Roca’s wettest month, receives 18 mm (0.7 in) of rainfall and has a maximum daytime temperature of 23°C (73°F). During the driest month August you can expect a temperature of 16°C (61°F).
For more detailed insights into the city’s temperatures, check out our Temperature page. To explore more about precipitation patterns, visit our General Roca Precipitation page.


