Cabrobó Sunshine Hours by Month
To truly understand a climate, we must look at its sunshine. This page shows the total number of hours of direct sunlight per month and the average hours per day in Cabrobó, Acre, Brazil. The figures are based on a 30-year period (1990–2020) to provide a reliable average.
Monthly hours of sunshine
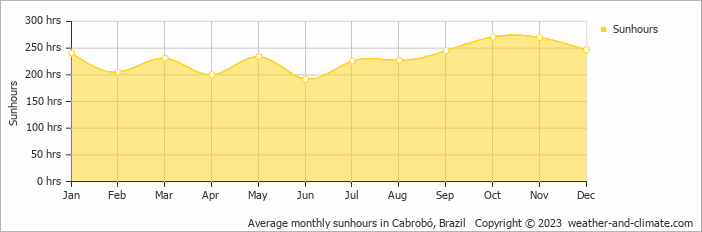
Cabrobó experiences sunny spells throughout the year. The sunniest month, October, sees up to 271 hours of sunshine, while June, the least sunny month, still provides a respectable 192 hours. The total annual sunshine amounts to 2789 hours.
Daily hours of sunshine
The difference in daily sunshine hours between October (9.0 hours per day) and June (6.4 hours per day) offers moderate variety for visitors and residents.
Cabrobó vs Major Cities: Sunshine Compared
Cabrobó enjoys an average of 2789 hours of sunshine annually. Let’s compare this with some popular tourist destinations:
The city of Rome, Italy, experiences 2470 hours of sunshine annually, adding to its charm as a year-round tourist destination.
In contrast, Juneau, Alaska, receives only about 1523 hours of sunshine per year and is known for its very short days in winter and frequently overcast conditions.
Meanwhile, Buenos Aires, Argentina, enjoys a humid subtropical climate with 2520 hours of sunshine annually.
Melbourne, Australia, has 2380 hours of sunshine annually, with its famous “four seasons in a day” weather pattern.
Related Climate Data for Cabrobó
March, Cabrobó’s wettest month, receives 18 mm (0.7 in) of rainfall and has a maximum daytime temperature of 34°C (93°F). During the driest month September you can expect a temperature of 34°C (93°F).
For more detailed insights into the city’s temperatures, check out our Temperature page. To explore more about precipitation patterns, visit our Cabrobó Precipitation page.