Average monthly wind speed in Blowing Point Village
The mean monthly wind speed over the year in Blowing Point Village (), Anguilla.
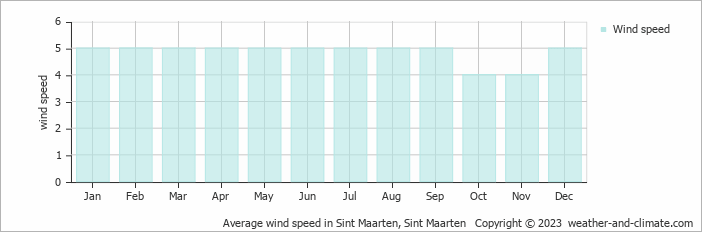
These figures come from monthly climatological averages showing that Blowing Point Village sees peak wind speeds of 5 m/s (10 knots) during its windiest period and minimum speeds of 4 m/s (8 knots) during its calmest season.
The 4 m/s (8 knots) average in October and November means Blowing Point Village experiences consistent moderate winds. Conditions vary from calm periods around to more active episodes throughout the month. At typical wind levels, smaller trees show steady branch movement. In common units, 4 m/s (8 knots) equals 14.4 km/h or 8.9 mph. While generally comfortable for most activities, occasional windy days may affect your plans and can make the air feel cooler.
However, January, February, March, April, May, June, July, August, September and December experiences average wind speeds of [5 m/s]. This means most days feature persistent breezes that cause large branches to sway and dust to blow around. The wind creates noticeable resistance. This speed translates to 18 kilometers per hour or 11.2 miles per hour. While intensity may vary at times, consistently windy weather is typical during this period. It's an ideal time for kite and windsurfing enthusiasts.
For more detailed information about Blowing Point Village’s weather, including monthly rainfall, sunshine hours, and humidity levels, visit our Blowing Point Village climate page.


