Average monthly wind speed in Xining
The mean monthly wind speed over the year in Xining (Qinghai), China.
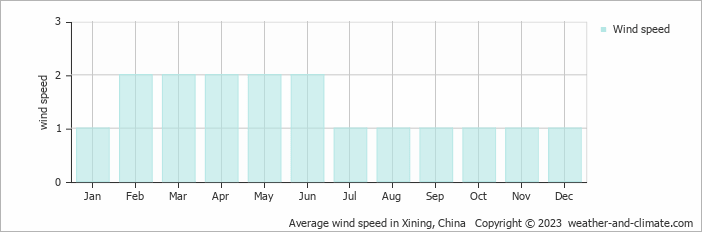
The average annual wind speed in Xining spans from 1 m/s (2 knots) to 2 m/s (4 knots).
With an average of 1 m/s (2 knots) during January, July, August, September, October, November and December, the air remains quite still most of the time. Daily variations range from completely calm periods to gentle breezes reaching 3 m/s (6 knots). At this low average, you'll barely notice air movement against your face. Converting to other units, this equals 3.6 km/h or 2.2 mph.
Weather experts classify this as "light air" on the Beaufort scale. Smoke from chimneys rises almost straight up with minimal drift. Leaves typically stay motionless, though occasional light stirring may occur. These conditions create a relaxed atmosphere where wind seldom interferes with plans or comfort.Wind speeds reach an average of 2 m/s (4 knots) in February, March, April, May and June. This means that on some days, the air is nearly still. There could also be gusts of up to 4 m/s (8 knots) on other days.
For more detailed information about Xining’s weather, including monthly rainfall, sunshine hours, and humidity levels, visit our Xining climate page.


