Monthly Average Rainy days in Xico
The number of days each month with rain, snow and hail in Xico (Veracruz), Mexico.
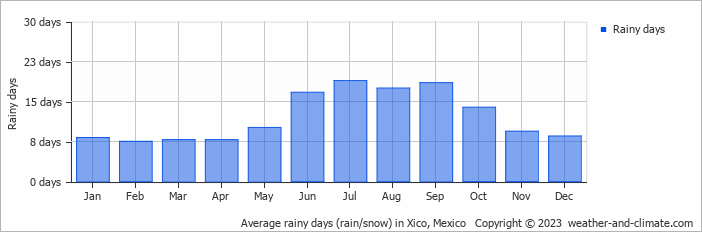
- Most rainy days are in June, July, August and September.
- On average, July is the most rainy with 18 days of rain/snow.
- On average, February is the driest month with 7 rainy days.
- The average annual number of rainy days is 144.
Current rainfall in Xico
Wed Jan 15
21°C | 11°C
E  1 m/s
1 m/s
1 m/s0.5 mm
broken clouds and small chance of slight rain
Thu Jan 16
21°C | 11°C
W 1 m/s
1 m/s7.2 mm
broken clouds and rain
Fri Jan 17
23°C | 13°C
W 2 m/s
2 m/salmost clear and no rain


