ClimateForecastAprilMay >>

Average monthly rainy days in Xhoris

The number of days each month with rain, snow and hail in Xhoris (Liege Province), Belgium.

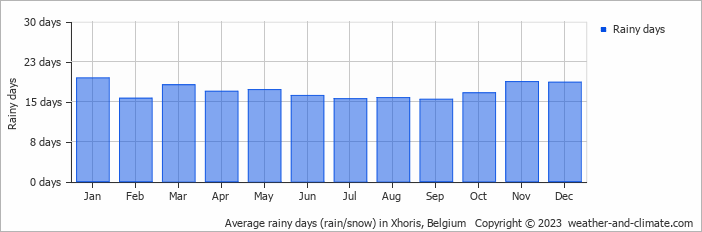
  • Most rainy days are in January, February, March, April, May, June, July, August, September, October, November and December.
  • On average, January is the most rainy with 19 days of rain/snow.
  • On average, September is the driest month with 15 rainy days.
  • The average annual number of rainy days is 203.

Weather Forecasts for Xhoris

Sun   Apr 28
14°C | 8°C
S 36 km/h
0.3 mm
broken clouds and  chance of slight rain

broken clouds and chance of slight rain

Mon   Apr 29
18°C | 8°C
S 18 km/h
0.5 mm
overcast and small chance of slight rain

overcast and small chance of slight rain

Tue   Apr 30
22°C | 11°C
SE 11 km/h
4.5 mm
broken clouds and  chance of rain

broken clouds and chance of rain

Interested in more climate information?

Weather and Climate provides you with all the information you need about the climate in Xhoris.

Our site offers climate and forecast data for every country in the world. Are you going to Belgium? On this website you can find historical weather averages for many cities in Belgium. Not sure yet where to go? We now have a tool which recommends destinations that suit your ideal climate conditions. Find out where to go with our weather planner.