Monthly Average Rainy days in Wongawallan
The number of days each month with rain, snow and hail in Wongawallan (Queensland), Australia.
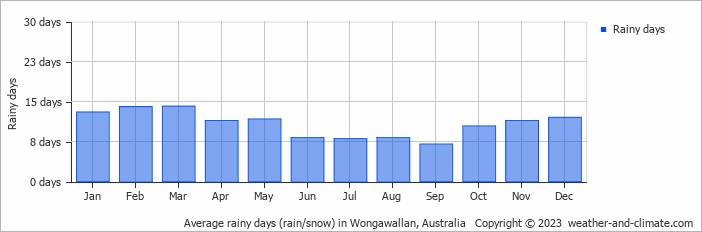
- On average, March is the most rainy with 14 days of rain/snow.
- On average, September is the driest month with 7 rainy days.
- The average annual number of rainy days is 129.
Current rainfall in Wongawallan
Fri Nov 22
23°C | 17°C
E  14 km/h
14 km/h30 mm
broken clouds and thunder
Sat Nov 23
26°C | 17°C
E 14 km/h
14 km/halmost clear and no rain
Sun Nov 24
27°C | 18°C
E 14 km/h
14 km/h1 mm
partly cloudy and rain


