ClimateForecastMayJune >>

Average monthly rainy days in West Wyalong

The number of days each month with rain, snow and hail in West Wyalong (New South Wales), Australia.

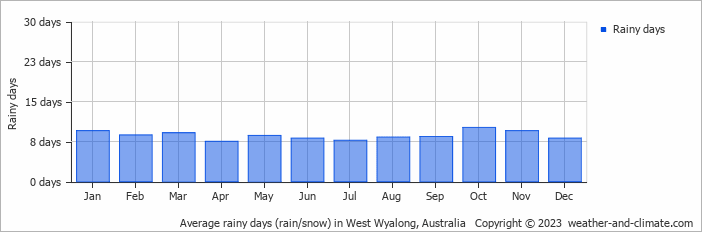
  • On average, October is the most rainy with 10 days of rain/snow.
  • On average, April is the driest month with 7 rainy days.
  • The average annual number of rainy days is 103.

Forecast for West Wyalong

Wed   May 29
23°C | 2°C
NE 18 km/h
almost clear and no rain

almost clear and no rain

Thu   May 30
23°C | 10°C
N 29 km/h
broken clouds and no rain

broken clouds and no rain

Fri   May 31
19°C | 7°C
W 14 km/h
19 mm
partly cloudy and rain

partly cloudy and rain

Interested in more climate information?

This site provides you with all the information you need about the climate in West Wyalong.

Our site offers climate and forecast data for every country in the world. Are you going to Australia? On this website you can find historical weather averages for many cities in Australia. Not sure yet where to go? We now have a tool which recommends destinations that suit your ideal climate conditions. Find out where to go with our weather planner.