ClimateForecastMayJune >>

Average monthly rainy days in Warwick

The number of days each month with rain, snow and hail in Warwick (Queensland), Australia.

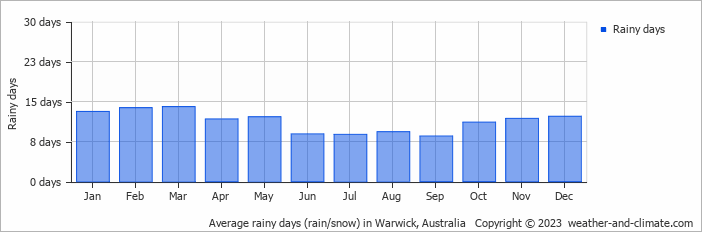
  • On average, March is the most rainy with 14 days of rain/snow.
  • On average, September is the driest month with 8 rainy days.
  • The average annual number of rainy days is 135.

Weather Forecasts for Warwick

Thu   May 02
20°C | 12°C
SE 32 km/h
almost clear and no rain

almost clear and no rain

Fri   May 03
20°C | 12°C
SE 25 km/h
0.3 mm
broken clouds and  chance of slight rain

broken clouds and chance of slight rain

Sat   May 04
19°C | 12°C
E 22 km/h
0.4 mm
broken clouds and slight rain

broken clouds and slight rain

Interested in more climate information?

Weather and Climate provides you with all the information you need about the climate in Warwick.

Our site offers climate and forecast data for every country in the world. Are you going to Australia? On this website you can find historical weather averages for many cities in Australia. Not sure yet where to go? We now have a tool which recommends destinations that suit your ideal climate conditions. Find out where to go with our weather planner.