ClimateForecastMayJune >>

Average monthly rainy days in Vinarós

The number of days each month with rain, snow and hail in Vinarós (Valencia Community), Spain.

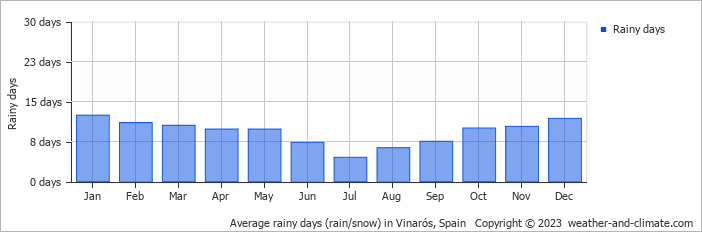
  • On average, January is the most rainy with 12 days of rain/snow.
  • On average, July is the driest month with 4 rainy days.
  • The average annual number of rainy days is 111.

Weather Forecasts for Vinarós

Thu   May 02
22°C | 11°C
S 22 km/h
0.3 mm
partly cloudy and small chance of slight rain

partly cloudy and small chance of slight rain

Fri   May 03
22°C | 9°C
SE 18 km/h
almost clear and no rain

almost clear and no rain

Sat   May 04
25°C | 10°C
SE 14 km/h
partly cloudy and no rain

partly cloudy and no rain

Interested in more climate information?

Weather and Climate provides you with all the information you need about the climate in Vinarós.

Our site offers climate and forecast data for every country in the world. Are you going to Spain? On this website you can find historical weather averages for many cities in Spain. Not sure yet where to go? We now have a tool which recommends destinations that suit your ideal climate conditions. Find out where to go with our weather planner.