ClimateForecastMayJune >>

Average monthly rainy days in Villanueva de la Cañada

The number of days each month with rain, snow and hail in Villanueva de la Cañada (Community of Madrid), Spain.

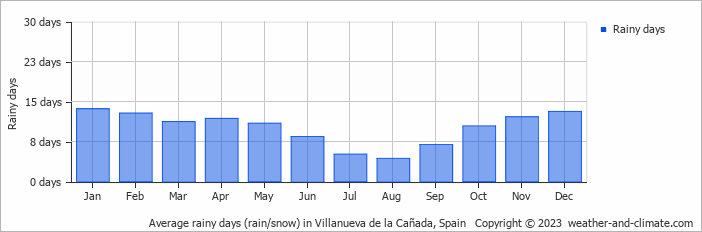
  • On average, January is the most rainy with 13 days of rain/snow.
  • On average, August is the driest month with 4 rainy days.
  • The average annual number of rainy days is 120.

Forecast for Villanueva de la Cañada

Fri   May 17
19°C | 11°C
SW 18 km/h
1.5 mm
partly cloudy and  chance of rain

partly cloudy and chance of rain

Sat   May 18
21°C | 9°C
SW 14 km/h
partly cloudy and no rain

partly cloudy and no rain

Sun   May 19
21°C | 10°C
SW 18 km/h
1.1 mm
partly cloudy and thunder

partly cloudy and thunder

Interested in more climate information?

This site provides you with all the information you need about the climate in Villanueva de la Cañada.

Our site offers climate and forecast data for every country in the world. Are you going to Spain? On this website you can find historical weather averages for many cities in Spain. Not sure yet where to go? We now have a tool which recommends destinations that suit your ideal climate conditions. Find out where to go with our weather planner.