ClimateForecastAprilMay >>

Average monthly rainy days in Villa La Angostura

The number of days each month with rain, snow and hail in Villa La Angostura (Neuquén Province), Argentina.

Average monthly rainy days in Villa La Angostura,

Feel free to add this climate graph to your website. Click the copy button above.

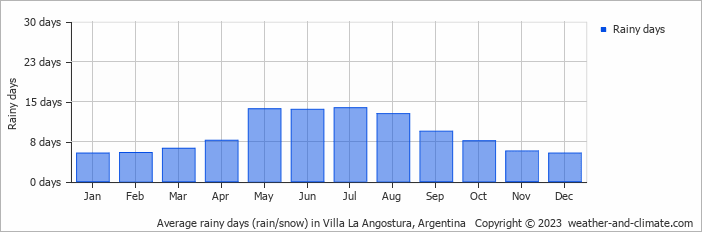
  • On average, July is the most rainy with 13 days of rain/snow.
  • On average, January is the driest month with 5 rainy days.
  • The average annual number of rainy days is 106.

Weather Forecasts for Villa La Angostura

Tue   Apr 16
11°C | 6°C
NW 18 km/h
8.7 mm
broken clouds and rain

broken clouds and rain

Wed   Apr 17
15°C | 3°C
NW 7 km/h
partly cloudy and no rain

partly cloudy and no rain

Thu   Apr 18
16°C | 3°C
NW 22 km/h
8 mm
broken clouds and rain

broken clouds and rain

Interested in more climate information?

Weather and Climate provides you with all the information you need about the climate in Villa La Angostura.

Our site offers climate and forecast data for every country in the world. Are you going to Argentina? On this website you can find historical weather averages for many cities in Argentina. Not sure yet where to go? We now have a tool which recommends destinations that suit your ideal climate conditions. Find out where to go with our weather planner.