Average Rainy - Precipitation days in Valencia de Alcántara
With 128 days and 623 mm of annual rain, Valencia de Alcántara has a moderate precipitation pattern. On this page, you can learn everything about the number of precipitation days.
Monthly Distribution of Rainy Days
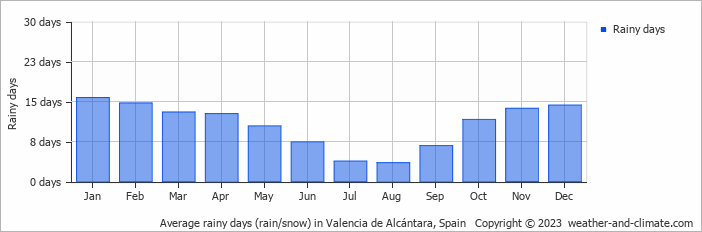
October is usually the wettest with 88 mm of rain over 12 rainy days, whereas July averages 5.2 mm during its 4 rainy days.
Amsterdam Precipitation Days Compared World Wide
Valencia de Alcántara's average annual precipitation falls over 128 days. Let's compare this to some popular worldwide tourist destinations:
Las Vegas, USA, gets about 26 precipitation days annually, which is typical for its arid desert climate.
Singapore, Singapore, records about 175 precipitation days per year, with rain spread fairly evenly throughout the year.
In Athens, Greece, it rains around 70 days in the year; therefore, it is one of the driest Mediterranean cities, mainly dominated by winter rainfall.
Boston, USA, experiences 134 precipitation days annually, including significant snow during winter.
Beijing, China, averages 72 precipitation days annually, concentrated in the summer months.
In Brisbane, Australia, the city averages 123 precipitation days per year, making it wetter than Sydney.
Rain Facts From Around the Globe
Here are some amazing facts about rain and precipitation worldwide:
- Cherrapunji, India, records an average of 322 rainy days each year. Despite this, the wettest place is Mount Waialeale in Hawaii with 11500 mm annual rainfall.
- The fastest recorded raindrop fell at 18 meters per second during a thunderstorm in Brazil.
- The Atacama Desert in Chile is so dry that some weather stations have never recorded rainfall since their installation.
- The largest recorded raindrop measured 8.8 mm in diameter during a tropical storm on La Réunion Island.
- Some clouds can weigh up to 500,000 tons, that's equivalent to the weight of 100 elephants.
For more detailed information about rainfall patterns in Valencia de Alcántara, visit our Rainfall & Precipitation page.
Current rainfall in Valencia de Alcántara


