ClimateForecastMayJune >>

Average monthly rainy days in Usina Beach

The number of days each month with rain, snow and hail in Usina Beach (), the United States of America.

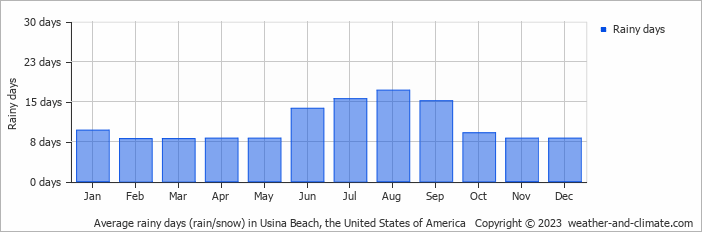
  • Most rainy days are in July, August and September.
  • On average, August is the most rainy with 17 days of rain/snow.
  • On average, March is the driest month with 8 rainy days.
  • The average annual number of rainy days is 128.

Weather Forecasts for Usina Beach

Thu   May 02
29°C | 19°C
E 18 km/h
0.2 mm
partly cloudy and small chance of slight rain

partly cloudy and small chance of slight rain

Fri   May 03
29°C | 19°C
E 18 km/h
0.2 mm
partly cloudy and small chance of slight rain

partly cloudy and small chance of slight rain

Sat   May 04
28°C | 20°C
E 18 km/h
0.2 mm
partly cloudy and small chance of slight rain

partly cloudy and small chance of slight rain

Interested in more climate information?

Weather and Climate provides you with all the information you need about the climate in Usina Beach.

Our site offers climate and forecast data for every country in the world. Are you going to the United States of America? On this website you can find historical weather averages for many cities in the United States of America. Not sure yet where to go? We now have a tool which recommends destinations that suit your ideal climate conditions. Find out where to go with our weather planner.