Monthly Average Rainy days in Ubajara
The number of days each month with rain, snow and hail in Ubajara (Ceará), Brazil.
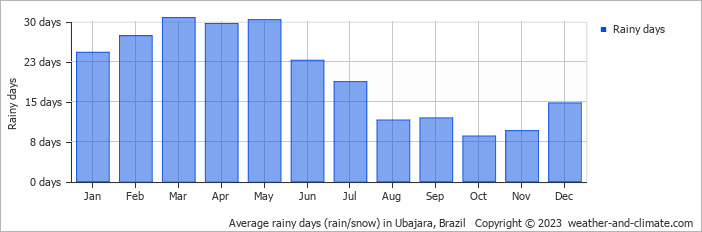
- Most rainy days are in January, February, March, April, May, June and July.
- On average, March is the most rainy with 30 days of rain/snow.
- On average, October is the driest month with 8 rainy days.
- The average annual number of rainy days is 239.
Current rainfall in Ubajara
Tue Jan 07
31°C | 21°C
E  4 m/s
4 m/s
4 m/s6.5 mm
partly cloudy and rain
Wed Jan 08
30°C | 21°C
E 3 m/s
3 m/s4.8 mm
broken clouds and thunder
Thu Jan 09
30°C | 21°C
E 3 m/s
3 m/s5.5 mm
broken clouds and rain


