ClimateForecastAprilMay >>

Average monthly rainy days in Tuxtla Gutiérrez

The number of days each month with rain, snow and hail in Tuxtla Gutiérrez (Chiapas), Mexico.

Average monthly rainy days in Tuxtla Gutiérrez,

Feel free to add this climate graph to your website. Click the copy button above.

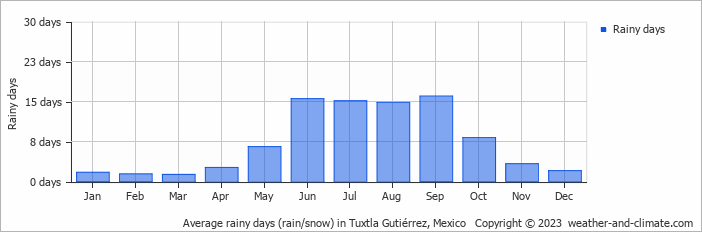
  • Most rainy days are in June, July and September.
  • Tuxtla Gutiérrez has dry periods in January, February, March and December.
  • On average, September is the most rainy with 16 days of rain/snow.
  • On average, March is the driest month with 1 rainy day.
  • The average annual number of rainy days is 88.

Weather Forecasts for Tuxtla Gutiérrez

Mon   Apr 15
38°C | 21°C
NW 25 km/h
partly cloudy and no rain

partly cloudy and no rain

Tue   Apr 16
41°C | 22°C
NW 29 km/h
clear and no rain

clear and no rain

Wed   Apr 17
41°C | 21°C
NW 29 km/h
almost clear and no rain

almost clear and no rain

Interested in more climate information?

Weather and Climate provides you with all the information you need about the climate in Tuxtla Gutiérrez.

Our site offers climate and forecast data for every country in the world. Are you going to Mexico? On this website you can find historical weather averages for many cities in Mexico. Not sure yet where to go? We now have a tool which recommends destinations that suit your ideal climate conditions. Find out where to go with our weather planner.