Monthly Average Rainy days in Torhout
The number of days each month with rain, snow and hail in Torhout (West-Flanders), Belgium.
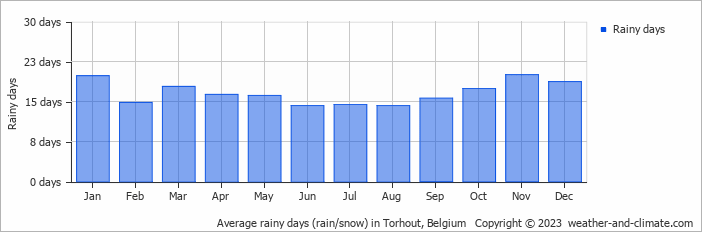
- Most rainy days are in January, March, April, May, September, October, November and December.
- On average, November is the most rainy with 20 days of rain/snow.
- On average, August is the driest month with 14 rainy days.
- The average annual number of rainy days is 199.
Current rainfall in Torhout
Sun Jan 05
12°C | 0°C
SW  9 m/s
9 m/s
9 m/s16 mm
overcast and heavy rain
Mon Jan 06
11°C | 4°C
SW 10 m/s
10 m/s3.8 mm
broken clouds and slight rain
Tue Jan 07
5°C | 1°C
W 7 m/s
7 m/s0.3 mm
broken clouds and chance of slight rain


