Monthly Average Rainy days in Tirau
The number of days each month with rain, snow and hail in Tirau (Waikato), New Zealand.
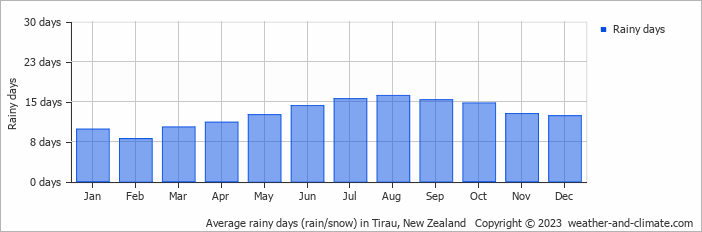
- Most rainy days are in July, August and September.
- On average, August is the most rainy with 16 days of rain/snow.
- On average, February is the driest month with 8 rainy days.
- The average annual number of rainy days is 152.
Current rainfall in Tirau
Mon Nov 18
21°C | 7°C
E  11 km/h
11 km/hpartly cloudy and no rain
Tue Nov 19
23°C | 7°C
W 14 km/h
14 km/halmost clear and no rain
Wed Nov 20
21°C | 9°C
W 25 km/h
25 km/h2.5 mm
partly cloudy and rain