ClimateForecastAprilMay >>

Average monthly rainy days in Þórshöfn

The number of days each month with rain, snow and hail in Þórshöfn (North Iceland), Iceland.

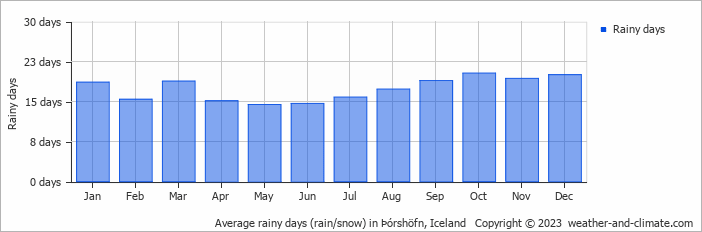
  • Most rainy days are in January, February, March, April, July, August, September, October, November and December.
  • On average, October is the most rainy with 20 days of rain/snow.
  • On average, May is the driest month with 14 rainy days.
  • The average annual number of rainy days is 208.

Weather Forecasts for Þórshöfn

Mon   Apr 29
5°C | 1°C
N 18 km/h
2.2 mm
overcast and small chance of rain

overcast and small chance of rain

Tue   Apr 30
4°C | 1°C
NW 22 km/h
0.5 mm
overcast and small chance of slight rain

overcast and small chance of slight rain

Wed   May 01
5°C | 0°C
SE 14 km/h
overcast and no rain

overcast and no rain

Interested in more climate information?

Weather and Climate provides you with all the information you need about the climate in Þórshöfn.

Our site offers climate and forecast data for every country in the world. Are you going to Iceland? On this website you can find historical weather averages for many cities in Iceland. Not sure yet where to go? We now have a tool which recommends destinations that suit your ideal climate conditions. Find out where to go with our weather planner.