ClimateForecastAprilMay >>

Average monthly rainy days in The Valley

The number of days each month with rain, snow and hail in The Valley (), Anguilla.

Average monthly rainy days in The Valley,

Feel free to add this climate graph to your website. Click the copy button above.

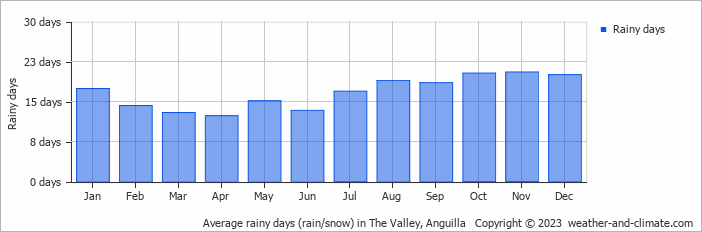
  • Most rainy days are in January, May, July, August, September, October, November and December.
  • On average, November is the most rainy with 20 days of rain/snow.
  • On average, April is the driest month with 12 rainy days.
  • The average annual number of rainy days is 200.

Weather Forecasts for The Valley

Thu   Apr 18
28°C | 25°C
NE 14 km/h
2.5 mm
partly cloudy and small chance of rain

partly cloudy and small chance of rain

Fri   Apr 19
28°C | 26°C
NE 14 km/h
3.7 mm
partly cloudy and  chance of rain

partly cloudy and chance of rain

Sat   Apr 20
28°C | 25°C
NE 22 km/h
1.5 mm
partly cloudy and  chance of rain

partly cloudy and chance of rain

Interested in more climate information?

Weather and Climate provides you with all the information you need about the climate in The Valley.

Our site offers climate and forecast data for every country in the world. Are you going to Anguilla? On this website you can find historical weather averages for many cities in Anguilla. Not sure yet where to go? We now have a tool which recommends destinations that suit your ideal climate conditions. Find out where to go with our weather planner.