Average Rainy - Precipitation days in Tanneron
Tanneron sees 97 days of precipitation annually, totaling to 948 mm of rain. Learn more about it on this page.
Monthly Distribution of Rainy Days
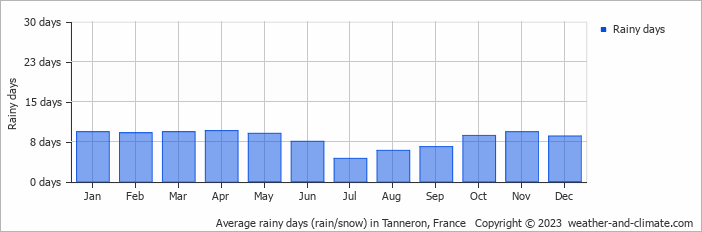
The wettest month is November, with 9 rainy days bringing 139 mm of rain. In contrast, July sees 4 rainy days with 35 mm of rain.
Amsterdam Precipitation Days Compared World Wide
Tanneron's average annual precipitation falls over 97 days. Let's compare this to some popular worldwide tourist destinations:
Las Vegas, USA, gets about 26 precipitation days annually, which is typical for its arid desert climate.
Singapore, Singapore, records about 175 precipitation days per year, with rain spread fairly evenly throughout the year.
The city of Rome, Italy, averages 131 precipitation days annually, spread fairly evenly throughout the year.
In Toronto, Canada, there are about 126 precipitation days per year, with snowfall occurring in winter and rainfall in summer.
Beijing, China, averages 72 precipitation days annually, concentrated in the summer months.
Perth, Australia, sees approximately 103 precipitation days annually, mostly during the winter months.
Fun facts about Rain from Around the World
Let’s explore more fascinating precipitation records:
- Tutunendo, Colombia, gets about 340 days of rain every year, which arguably makes it the wettest place in the world.
- On RĂ©union Island, a tropical cyclone generated 1825 mm in just 24 hours.
- Singapore receives thunder on 167 days in the year and is considered one of the most thunderous cities in the world.
- The smallest drops that fall are called drizzle drops, and they have a diameter of 0.5 mm.
- Some heavy storms generate "diamond dust," which consists of very small ice crystals that float in the air.
For more detailed information about rainfall patterns in Tanneron, visit our Rainfall & Precipitation page.
Current rainfall in Tanneron