Monthly Average Rainy days in Tacámbaro de Codallos
The number of days each month with rain, snow and hail in Tacámbaro de Codallos (Michoacan), Mexico.
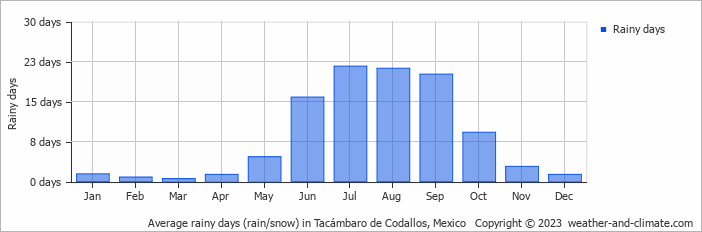
- Most rainy days are in June, July, August and September.
- Tacámbaro de Codallos has dry periods in January, February, March, April and December.
- On average, July is the most rainy with 21 days of rain/snow.
- On average, March is the driest month with 0 rainy days.
- The average annual number of rainy days is 100.
Current rainfall in Tacámbaro de Codallos
Thu Nov 14
26°C | 13°C
SE  11 km/h
11 km/halmost clear and no rain
Fri Nov 15
26°C | 14°C
S 11 km/h
11 km/halmost clear and no rain
Sat Nov 16
26°C | 15°C
SE 7 km/h
7 km/h0.4 mm
partly cloudy and chance of slight rain


