ClimateForecastAprilMay >>

Average monthly rainy days in Suchitoto

The number of days each month with rain, snow and hail in Suchitoto (), El Salvador.

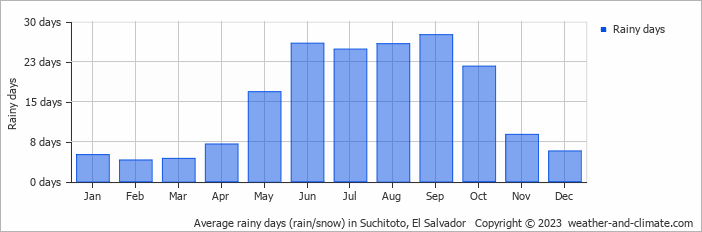
  • Most rainy days are in May, June, July, August, September and October.
  • On average, September is the most rainy with 27 days of rain/snow.
  • On average, February is the driest month with 4 rainy days.
  • The average annual number of rainy days is 177.

Weather Forecasts for Suchitoto

Fri   Apr 26
39°C | 24°C
S 14 km/h
1.7 mm
partly cloudy and  chance of slight rain

partly cloudy and chance of slight rain

Sat   Apr 27
38°C | 24°C
S 18 km/h
8 mm
partly cloudy and thunder

partly cloudy and thunder

Sun   Apr 28
36°C | 24°C
S 11 km/h
5.8 mm
partly cloudy and thunder

partly cloudy and thunder

Interested in more climate information?

Weather and Climate provides you with all the information you need about the climate in Suchitoto.

Our site offers climate and forecast data for every country in the world. Are you going to El Salvador? On this website you can find historical weather averages for many cities in El Salvador. Not sure yet where to go? We now have a tool which recommends destinations that suit your ideal climate conditions. Find out where to go with our weather planner.