ClimateForecastMayJune >>

Average monthly rainy days in Sarina

The number of days each month with rain, snow and hail in Sarina (Queensland), Australia.

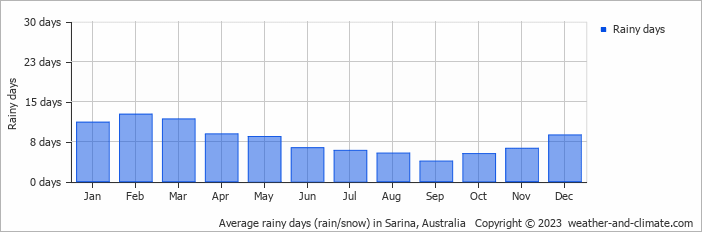
  • On average, February is the most rainy with 12 days of rain/snow.
  • On average, September is the driest month with 3 rainy days.
  • The average annual number of rainy days is 94.

Forecast for Sarina

Thu   May 30
24°C | 17°C
E 22 km/h
0.8 mm
partly cloudy and rain

partly cloudy and rain

Fri   May 31
25°C | 16°C
E 11 km/h
almost clear and no rain

almost clear and no rain

Sat   Jun 01
25°C | 16°C
NE 7 km/h
1.9 mm
broken clouds and slight rain

broken clouds and slight rain

Interested in more climate information?

This site provides you with all the information you need about the climate in Sarina.

Our site offers climate and forecast data for every country in the world. Are you going to Australia? On this website you can find historical weather averages for many cities in Australia. Not sure yet where to go? We now have a tool which recommends destinations that suit your ideal climate conditions. Find out where to go with our weather planner.