Monthly Average Rainy days in San Pedro La Laguna
The number of days each month with rain, snow and hail in San Pedro La Laguna (Solola), Guatemala.
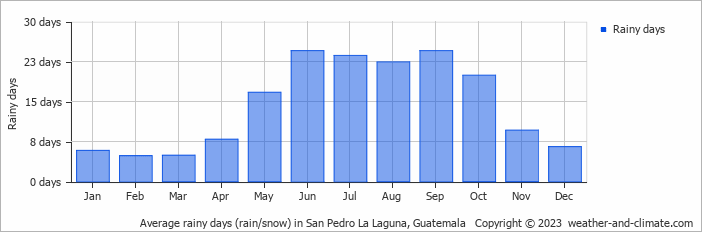
- Most rainy days are in May, June, July, August, September and October.
- On average, September is the most rainy with 24 days of rain/snow.
- On average, February is the driest month with 4 rainy days.
- The average annual number of rainy days is 171.
Current rainfall in San Pedro La Laguna
Fri Nov 22
24°C | 14°C
N  11 km/h
11 km/h2.5 mm
broken clouds and chance of rain
Sat Nov 23
22°C | 14°C
N 7 km/h
7 km/h3.9 mm
broken clouds and rain
Sun Nov 24
21°C | 14°C
SW 7 km/h
7 km/h1.9 mm
partly cloudy and rain


