Monthly Average Rainy days in San Juan del Río
The number of days each month with rain, snow and hail in San Juan del Río (Querétaro), Mexico.
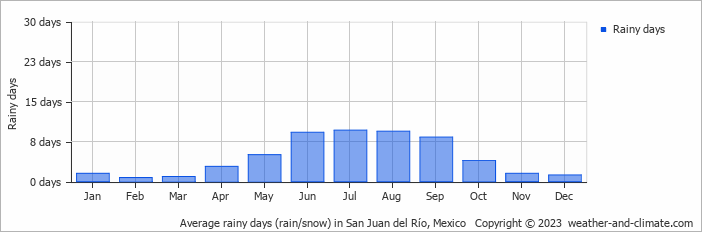
- San Juan del Río has dry periods in January, February, March, November and December.
- On average, July is the most rainy with 9 days of rain/snow.
- On average, February is the driest month with 0 rainy days.
- The average annual number of rainy days is 54.
Current rainfall in San Juan del Río
Mon Jan 06
22°C | 6°C
E  4 m/s
4 m/s
4 m/s0.2 mm
broken clouds and thunder
Tue Jan 07
21°C | 7°C
NW 3 m/s
3 m/sovercast and no rain
Wed Jan 08
21°C | 5°C
NW 3 m/s
3 m/s0.9 mm
partly cloudy and thunder


