Average Rainy - Precipitation days in Salbris
With 169 days and 825 mm of annual rain/snow, Salbris has a moderate precipitation pattern. On this page, you can learn everything about the number of precipitation days.
Monthly Distribution of Rainy Days
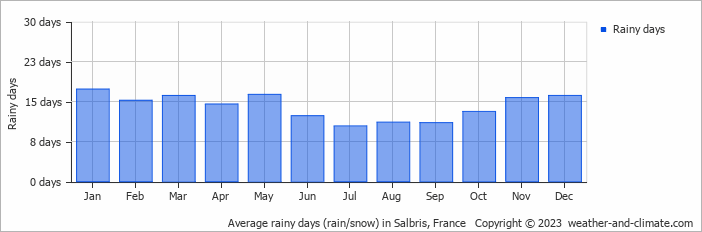
The wettest month is December, with 16 rainy days bringing 83 mm of rain. In contrast, August sees 11 rainy days with 54 mm of rain.
Amsterdam Precipitation Days Compared World Wide
On average, Salbris receives over 169 days of precipitation annually. For comparison, here is some data from popular tourist destinations around the world:In Riyadh, Saudi Arabia, there are about 29 precipitation days annually, reflecting its dry desert environment.
In Kuala Lumpur, Malaysia, the city experiences around 212 precipitation days annually, consistent with its tropical rainforest climate.
In Barcelona, Spain, there are approximately 121 precipitation days per year, evenly distributed across the year with no extreme wet or dry seasons.
Every year, the city of New York, USA, records about 130 precipitation days, with rainfall evenly distributed throughout the year.
Osaka, Japan, experiences 198 precipitation days annually, with wetter summers compared to winter.
Adelaide, Australia, records about 86 precipitation days per year, with dry summers and wet winters.
Rain Facts From Around the Globe
Let’s explore more fascinating precipitation records:
- Tutunendo, Colombia, gets about 340 days of rain every year, which arguably makes it the wettest place in the world.
- On Réunion Island, a tropical cyclone generated 1825 mm in just 24 hours.
- Singapore receives thunder on 167 days in the year and is considered one of the most thunderous cities in the world.
- The smallest drops that fall are called drizzle drops, and they have a diameter of 0.5 mm.
- Some heavy storms generate "diamond dust," which consists of very small ice crystals that float in the air.
For more detailed information about rainfall patterns in Salbris, visit our Rainfall & Precipitation page.
Current rainfall in Salbris