Monthly Average Rainy days in Quixadá
The number of days each month with rain, snow and hail in Quixadá (Ceará), Brazil.
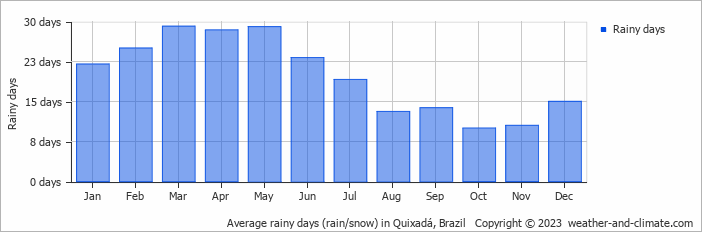
- Most rainy days are in January, February, March, April, May, June, July and December.
- On average, March is the most rainy with 29 days of rain/snow.
- On average, October is the driest month with 10 rainy days.
- The average annual number of rainy days is 238.
Current rainfall in Quixadá
Sun Dec 22
36°C | 25°C
E  4 m/s
4 m/s
4 m/s0.1 mm
partly cloudy and small chance of slight rain
Mon Dec 23
36°C | 25°C
E 4 m/s
4 m/spartly cloudy and no rain
Tue Dec 24
37°C | 24°C
E 4 m/s
4 m/salmost clear and no rain