ClimateForecastAprilMay >>

Average monthly rainy days in Punta Laurel

The number of days each month with rain, snow and hail in Punta Laurel (Bocas del Toro), Panama.

Average monthly rainy days in Punta Laurel,

Feel free to add this climate graph to your website. Click the copy button above.

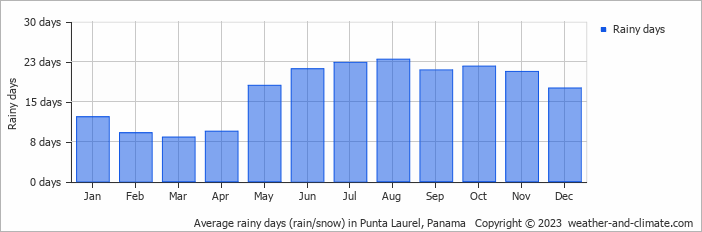
  • Most rainy days are in May, June, July, August, September, October, November and December.
  • On average, August is the most rainy with 22 days of rain/snow.
  • On average, March is the driest month with 8 rainy days.
  • The average annual number of rainy days is 203.

Weather Forecasts for Punta Laurel

Fri   Apr 19
31°C | 25°C
NE 14 km/h
almost clear and no rain

almost clear and no rain

Sat   Apr 20
32°C | 26°C
NE 14 km/h
broken clouds and no rain

broken clouds and no rain

Sun   Apr 21
33°C | 26°C
NE 14 km/h
1.1 mm
broken clouds and  chance of slight rain

broken clouds and chance of slight rain

Interested in more climate information?

Weather and Climate provides you with all the information you need about the climate in Punta Laurel.

Our site offers climate and forecast data for every country in the world. Are you going to Panama? On this website you can find historical weather averages for many cities in Panama. Not sure yet where to go? We now have a tool which recommends destinations that suit your ideal climate conditions. Find out where to go with our weather planner.