ClimateForecastMayJune >>

Average monthly rainy days in Punta Gorda (FL)

The number of days each month with rain, snow and hail in Punta Gorda (Florida), the United States of America.

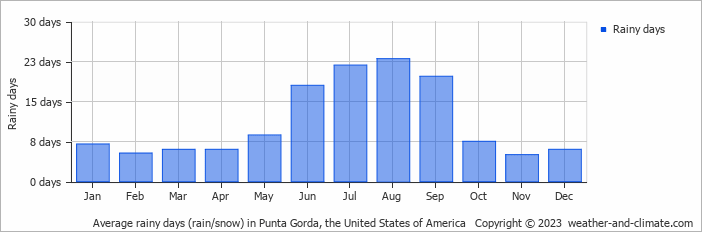
  • Most rainy days are in June, July, August and September.
  • On average, August is the most rainy with 23 days of rain/snow.
  • On average, November is the driest month with 5 rainy days.
  • The average annual number of rainy days is 134.

Forecast for Punta Gorda (FL)

Sun   May 05
33°C | 21°C
SE 18 km/h
2.9 mm
partly cloudy and  chance of slight rain

partly cloudy and chance of slight rain

Mon   May 06
34°C | 19°C
SE 14 km/h
0.2 mm
partly cloudy and small chance of slight rain

partly cloudy and small chance of slight rain

Tue   May 07
33°C | 20°C
W 18 km/h
0.8 mm
partly cloudy and  chance of rain

partly cloudy and chance of rain

Interested in more climate information?

This site provides you with all the information you need about the climate in Punta Gorda.

Our site offers climate and forecast data for every country in the world. Are you going to the United States of America? On this website you can find historical weather averages for many cities in the United States of America. Not sure yet where to go? We now have a tool which recommends destinations that suit your ideal climate conditions. Find out where to go with our weather planner.