ClimateForecastAprilMay >>

Average monthly rainy days in Puerto López

The number of days each month with rain, snow and hail in Puerto López (), Ecuador.

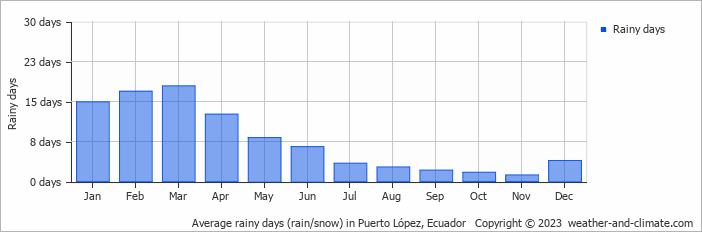
  • Most rainy days are in February and March.
  • Puerto López has dry periods in October and November.
  • On average, March is the most rainy with 17 days of rain/snow.
  • On average, November is the driest month with 1 rainy day.
  • The average annual number of rainy days is 91.

Weather Forecasts for Puerto López

Wed   Apr 24
31°C | 24°C
W 14 km/h
0.4 mm
broken clouds and  chance of slight rain

broken clouds and chance of slight rain

Thu   Apr 25
31°C | 23°C
W 14 km/h
1.7 mm
almost clear and small chance of slight rain

almost clear and small chance of slight rain

Fri   Apr 26
30°C | 23°C
SW 14 km/h
partly cloudy and no rain

partly cloudy and no rain

Interested in more climate information?

Weather and Climate provides you with all the information you need about the climate in Puerto López.

Our site offers climate and forecast data for every country in the world. Are you going to Ecuador? On this website you can find historical weather averages for many cities in Ecuador. Not sure yet where to go? We now have a tool which recommends destinations that suit your ideal climate conditions. Find out where to go with our weather planner.