ClimateForecastAprilMay >>

Average monthly rainy days in Port Willunga

The number of days each month with rain, snow and hail in Port Willunga (South Australia), Australia.

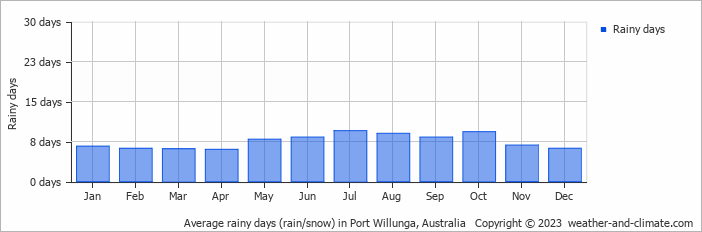
  • On average, July is the most rainy with 9 days of rain/snow.
  • On average, April is the driest month with 6 rainy days.
  • The average annual number of rainy days is 90.

Weather Forecasts for Port Willunga

Mon   Apr 29
18°C | 10°C
SE 18 km/h
broken clouds and no rain

broken clouds and no rain

Tue   Apr 30
15°C | 9°C
SE 22 km/h
almost clear and no rain

almost clear and no rain

Wed   May 01
16°C | 7°C
SE 22 km/h
almost clear and no rain

almost clear and no rain

Interested in more climate information?

Weather and Climate provides you with all the information you need about the climate in Port Willunga.

Our site offers climate and forecast data for every country in the world. Are you going to Australia? On this website you can find historical weather averages for many cities in Australia. Not sure yet where to go? We now have a tool which recommends destinations that suit your ideal climate conditions. Find out where to go with our weather planner.