ClimateForecastAprilMay >>

Average monthly rainy days in Port Macquarie

The number of days each month with rain, snow and hail in Port Macquarie (New South Wales), Australia.

Average monthly rainy days in Port Macquarie,

Feel free to add this climate graph to your website. Click the copy button above.

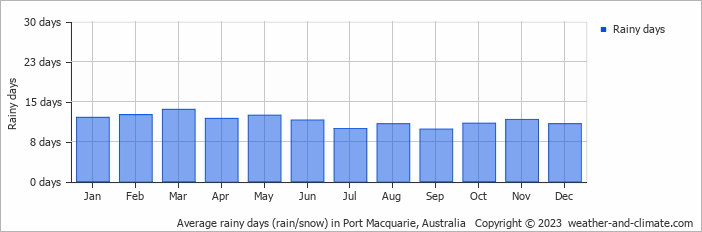
  • On average, March is the most rainy with 13 days of rain/snow.
  • On average, September is the driest month with 9 rainy days.
  • The average annual number of rainy days is 137.

Weather Forecasts for Port Macquarie

Fri   Apr 19
22°C | 15°C
S 18 km/h
almost clear and no rain

almost clear and no rain

Sat   Apr 20
21°C | 16°C
SW 22 km/h
15 mm
overcast and heavy rain

overcast and heavy rain

Sun   Apr 21
22°C | 16°C
S 18 km/h
6.3 mm
partly cloudy and rain

partly cloudy and rain

Interested in more climate information?

Weather and Climate provides you with all the information you need about the climate in Port Macquarie.

Our site offers climate and forecast data for every country in the world. Are you going to Australia? On this website you can find historical weather averages for many cities in Australia. Not sure yet where to go? We now have a tool which recommends destinations that suit your ideal climate conditions. Find out where to go with our weather planner.