Monthly Average Rainy days in Port Arthur
The number of days each month with rain, snow and hail in Port Arthur (Tasmania), Australia.
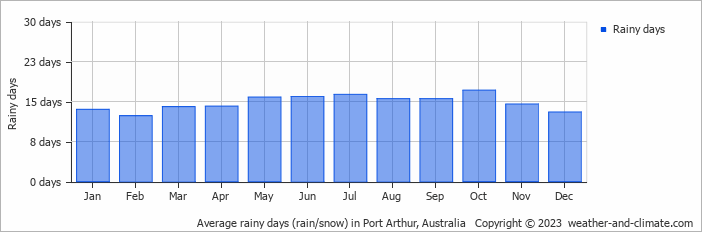
- Most rainy days are in May, June, July, August, September and October.
- On average, October is the most rainy with 17 days of rain/snow.
- On average, February is the driest month with 12 rainy days.
- The average annual number of rainy days is 177.
Current rainfall in Port Arthur
Fri Dec 13
18°C | 11°C
W  25 km/h
25 km/h1.3 mm
broken clouds and rain
Sat Dec 14
19°C | 9°C
NW 14 km/h
14 km/hbroken clouds and no rain
Sun Dec 15
20°C | 11°C
NE 22 km/h
22 km/h0.7 mm
partly cloudy and chance of slight rain


