ClimateForecastMayJune >>

Average monthly rainy days in Porirua

The number of days each month with rain, snow and hail in Porirua (Wellington), New Zealand.

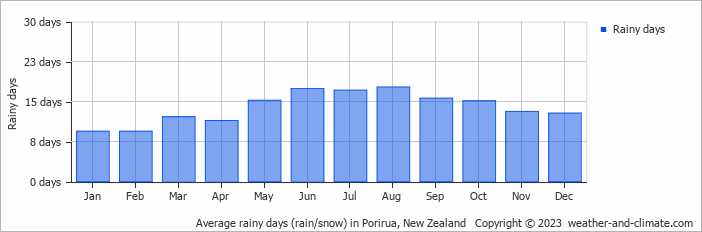
  • Most rainy days are in May, June, July, August, September and October.
  • On average, August is the most rainy with 17 days of rain/snow.
  • On average, February is the driest month with 9 rainy days.
  • The average annual number of rainy days is 166.

Forecast for Porirua

Sat   May 11
13°C | 4°C
S 25 km/h
partly cloudy and no rain

partly cloudy and no rain

Sun   May 12
14°C | 4°C
NE 18 km/h
0.8 mm
partly cloudy and  chance of slight rain

partly cloudy and chance of slight rain

Mon   May 13
14°C | 5°C
NE 7 km/h
0.9 mm
partly cloudy and rain

partly cloudy and rain

Interested in more climate information?

This site provides you with all the information you need about the climate in Porirua.

Our site offers climate and forecast data for every country in the world. Are you going to New Zealand? On this website you can find historical weather averages for many cities in New Zealand. Not sure yet where to go? We now have a tool which recommends destinations that suit your ideal climate conditions. Find out where to go with our weather planner.