Monthly Average Rainy days in Playas de Orihuela
The number of days each month with rain, snow and hail in Playas de Orihuela (Valencia Community), Spain.
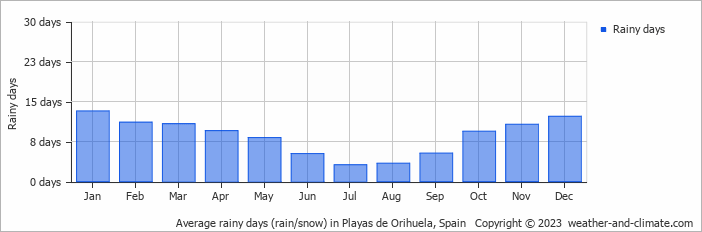
- On average, January is the most rainy with 13 days of rain/snow.
- On average, July is the driest month with 3 rainy days.
- The average annual number of rainy days is 102.
Current rainfall in Playas de Orihuela
Wed Dec 04
20°C | 11°C
NW  18 km/h
18 km/h3.2 mm
partly cloudy and rain
Thu Dec 05
23°C | 9°C
W 22 km/h
22 km/hpartly cloudy and no rain
Fri Dec 06
23°C | 10°C
W 22 km/h
22 km/halmost clear and no rain


