Average monthly rainy days in Playa Blanca

The number of days each month with rain, snow and hail in Playa Blanca (Canary Islands), Spain.

Average monthly rainy days in Playa Blanca,

Feel free to add this climate graph to your website. Click the copy button above.

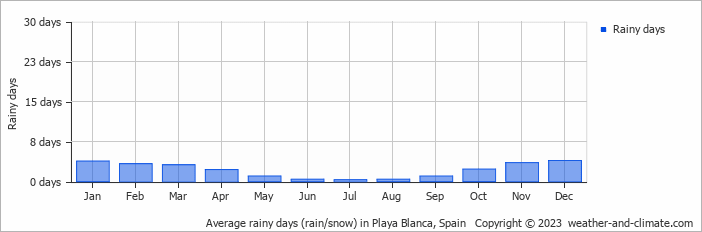
  • Playa Blanca has dry periods in May, June, July, August and September.
  • On average, December is the most rainy with 3 days of rain/snow.
  • On average, July is the driest month with 0 rainy days.
  • The average annual number of rainy days is 24.

Weather Forecasts for Playa Blanca

Fri   Mar 29
22°C | 16°C
NW 36 km/h
almost clear and no rain

almost clear and no rain

Sat   Mar 30
22°C | 16°C
W 32 km/h
1.3 mm
partly cloudy and small chance of rain

partly cloudy and small chance of rain

Sun   Mar 31
24°C | 16°C
W 29 km/h
0.7 mm
partly cloudy and  chance of slight rain

partly cloudy and chance of slight rain

Interested in more climate information?

Weather and Climate provides you with all the information you need about the climate in Playa Blanca.

Our site offers climate and forecast data for every country in the world. Are you going to Spain? On this website you can find historical weather averages for many cities in Spain. Not sure yet where to go? We now have a tool which recommends destinations that suit your ideal climate conditions. Find out where to go with our weather planner.