ClimateForecastSeptemberOctober >>

Monthly Average Rainy days in Pirongia

The number of days each month with rain, snow and hail in Pirongia (Waikato), New Zealand.

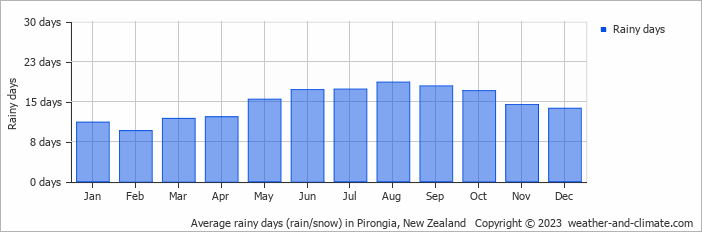
  • Most rainy days are in May, June, July, August, September and October.
  • On average, August is the most rainy with 18 days of rain/snow.
  • On average, February is the driest month with 9 rainy days.
  • The average annual number of rainy days is 175.

Current rainfall in Pirongia

Sun   Sep 08
15°C | 8°C
SW 25 km/h
0.6 mm
partly cloudy and slight rain

partly cloudy and slight rain

Mon   Sep 09
15°C | 6°C
NW 18 km/h
broken clouds and no rain

broken clouds and no rain

Tue   Sep 10
17°C | 10°C
W 22 km/h
3.6 mm
broken clouds and rain

broken clouds and rain

Interested in more climate information?

This site provides you with all the information you need about the climate in Pirongia.

Our site offers climate and forecast data for every country in the world. Are you going to New Zealand? On this website you can find historical weather averages for many cities in New Zealand. Not sure yet where to go? We now have a tool which recommends destinations that suit your ideal travel conditions. Find out where to go with our weather planner.