Monthly Average Rainy days in Piedra Pinta
The number of days each month with rain, snow and hail in Piedra Pinta (Veracruz), Mexico.
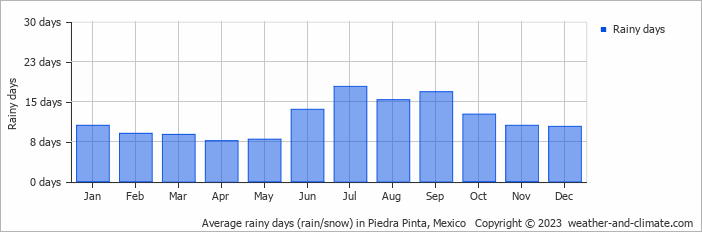
- Most rainy days are in July, August and September.
- On average, July is the most rainy with 17 days of rain/snow.
- On average, April is the driest month with 7 rainy days.
- The average annual number of rainy days is 140.
Current rainfall in Piedra Pinta
Wed Jan 15
24°C | 14°C
N  2 m/s
2 m/s
2 m/s1.6 mm
partly cloudy and no rain
Thu Jan 16
20°C | 13°C
NW 3 m/s
3 m/s4.8 mm
overcast and chance of rain
Fri Jan 17
25°C | 13°C
NE 2 m/s
2 m/salmost clear and no rain


