Monthly Average Rainy days in Pechón
The number of days each month with rain, snow and hail in Pechón (Cantabria), Spain.
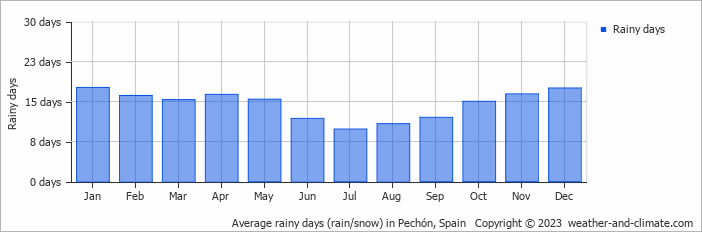
- Most rainy days are in January, February, March, April, May, October, November and December.
- On average, January is the most rainy with 17 days of rain/snow.
- On average, July is the driest month with 9 rainy days.
- The average annual number of rainy days is 173.
Current rainfall in Pechón
Sun Dec 22
17°C | 10°C
NW  6 m/s
6 m/s
6 m/s5.1 mm
broken clouds and rain
Mon Dec 23
14°C | 10°C
NW 5 m/s
5 m/s4.4 mm
broken clouds and rain
Tue Dec 24
15°C | 11°C
W 4 m/s
4 m/s2.7 mm
overcast and rain


