Monthly Average Rainy days in Papantla de Olarte
The number of days each month with rain, snow and hail in Papantla de Olarte (Veracruz), Mexico.
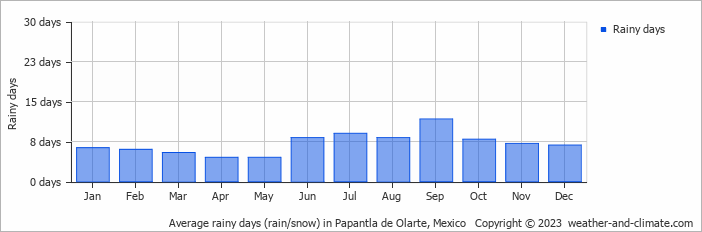
- On average, September is the most rainy with 11 days of rain/snow.
- On average, May is the driest month with 4 rainy days.
- The average annual number of rainy days is 85.
Current rainfall in Papantla de Olarte
Fri Nov 15
30°C | 19°C
NE  11 km/h
11 km/h0.5 mm
partly cloudy and small chance of slight rain
Sat Nov 16
30°C | 20°C
E 11 km/h
11 km/hbroken clouds and no rain
Sun Nov 17
31°C | 20°C
E 11 km/h
11 km/hpartly cloudy and no rain


