Average monthly rainy days in Panama City (Panama)

The number of days each month with rain, snow and hail in Panama City, Panama.

Average rainy days (rain/snow) in Panama City, Panama   Copyright © 2023  weather-and-climate.com

Feel free to add this climate graph to your website. Click the copy button above.

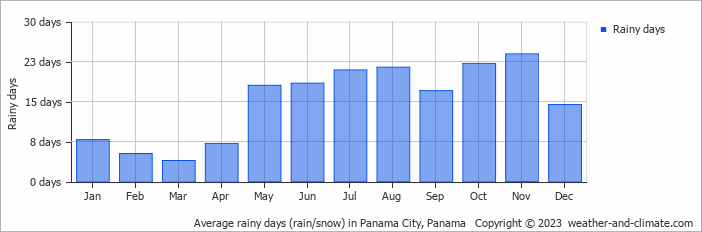
  • Most rainy days are in May, June, July, August, September, October and November.
  • On average, November is the most rainy with 23 days of rain/snow.
  • On average, March is the driest month with 3 rainy days.
  • The average annual number of rainy days is: 180.

Weather Forecasts for Panama City (Panama)

Sat   Dec 09
33°C | 25°C
N 14 km/h
1.7 mm
partly cloudy and  chance of rain

partly cloudy and chance of rain

Sun   Dec 10
33°C | 26°C
NW 14 km/h
3.6 mm
partly cloudy and thunder

partly cloudy and thunder

Mon   Dec 11
32°C | 25°C
NW 14 km/h
9.9 mm
broken clouds and thunder

broken clouds and thunder

Interested in more climate information?

Weather and Climate provides you with all the information you need about the climate in Panama City.

Our site offers climate and forecast data for every country in the world. Are you going to Panama? On this website you can find historical weather averages for many cities in Panama. Not sure yet where to go? We now have a tool which recommends destinations that suit your ideal climate conditions. Find out where to go with our weather planner.